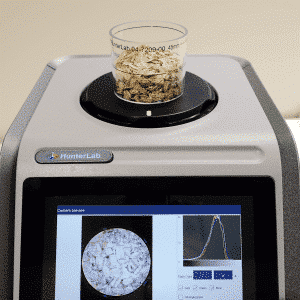
 The precise color measurement of oat flakes with statistical averaging on the Agera color measurement device is particularly useful for oat flakes, as they are among the samples that consist of different particles and have uneven color distribution or surface texture. In any case, the samples should be measured at least two to five times, with rotation or refilling between measurements, so that a meaningful mean value can be formed. The standard deviation and range (scatter) can be read off for each individual measurement.
Table 1 shows the results of five individual measurements with the Agera from Hunterlab. For this purpose, oat flakes from one batch were filled into a glass cuvette with a diameter of 6 cm and the color was measured through the bottom of the cuvette. Between measurements, the cuvette was emptied and refilled from the same batch. The mean value was then calculated from these 5 measurements. The range (scatter) and the standard deviation of the values allow an estimation of the fluctuations in the measured values for these samples, which are not very uniform.

Measuring from below through the bottom of the cuvette is particularly advantageous for small-grained samples or powders, as this produces a more uniform surface structure than when viewed from above. In addition, the Agera has a special built-in camera that can take a picture of the sample as it is “seen” by the sensor. An RGB histogram of the recording can also be displayed at the same time. This recording can be saved together with the measurement data.

